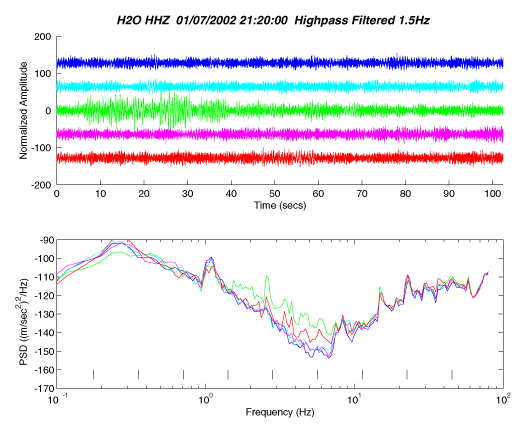

Figure 13. The top panel shows time series near the earthquake at 3.6hr in Figure 11. The earthquake occurs between 10 and 60s on the middle trace. The bottom panel shows the corresponding color-coded power spectral density (PSD) in counts squared per hertz. The microseism peak level is unchanged, but levels above the microseism peak increase by up to 20 dB. The events in Figures 12 and 13, which are observed on seismometers on the seafloor, have similar
 Retun
to the 2003 Fall AGU Poster
BROADBAND SEISMIC OBSERVATIONS AT THE HAWAII-2 OBSERVATORY DURING ODP LEG 200