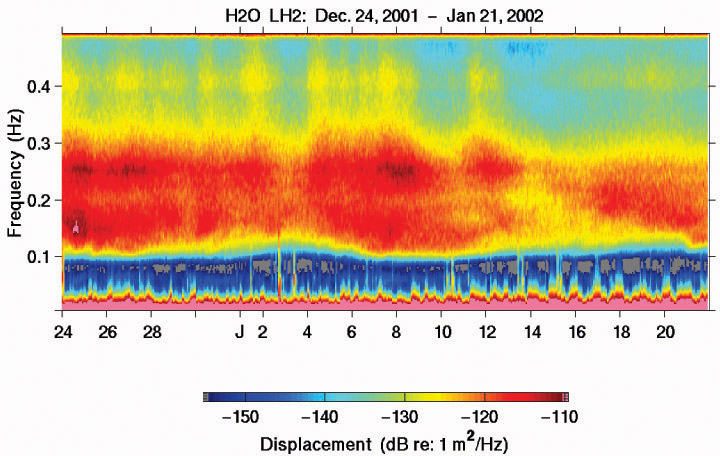
Figure 8. Horizontal component spectrograms
in the band 0.01-0.5Hz on one of the Guralp horizontals are shown for a 22day
window during the drilling on Leg 200. The peaks near 0.4Hz correlate with local
storm activity, while the 0.1-0.3Hz signals occur with the arrival of swell
from distant storms. The noise (increasing to the right) at long periods appears
to be caused by tidal currents.
![]() Retun
to the 2003 Fall AGU Poster
Retun
to the 2003 Fall AGU Poster
BROADBAND SEISMIC OBSERVATIONS AT THE HAWAII-2 OBSERVATORY DURING ODP LEG 200