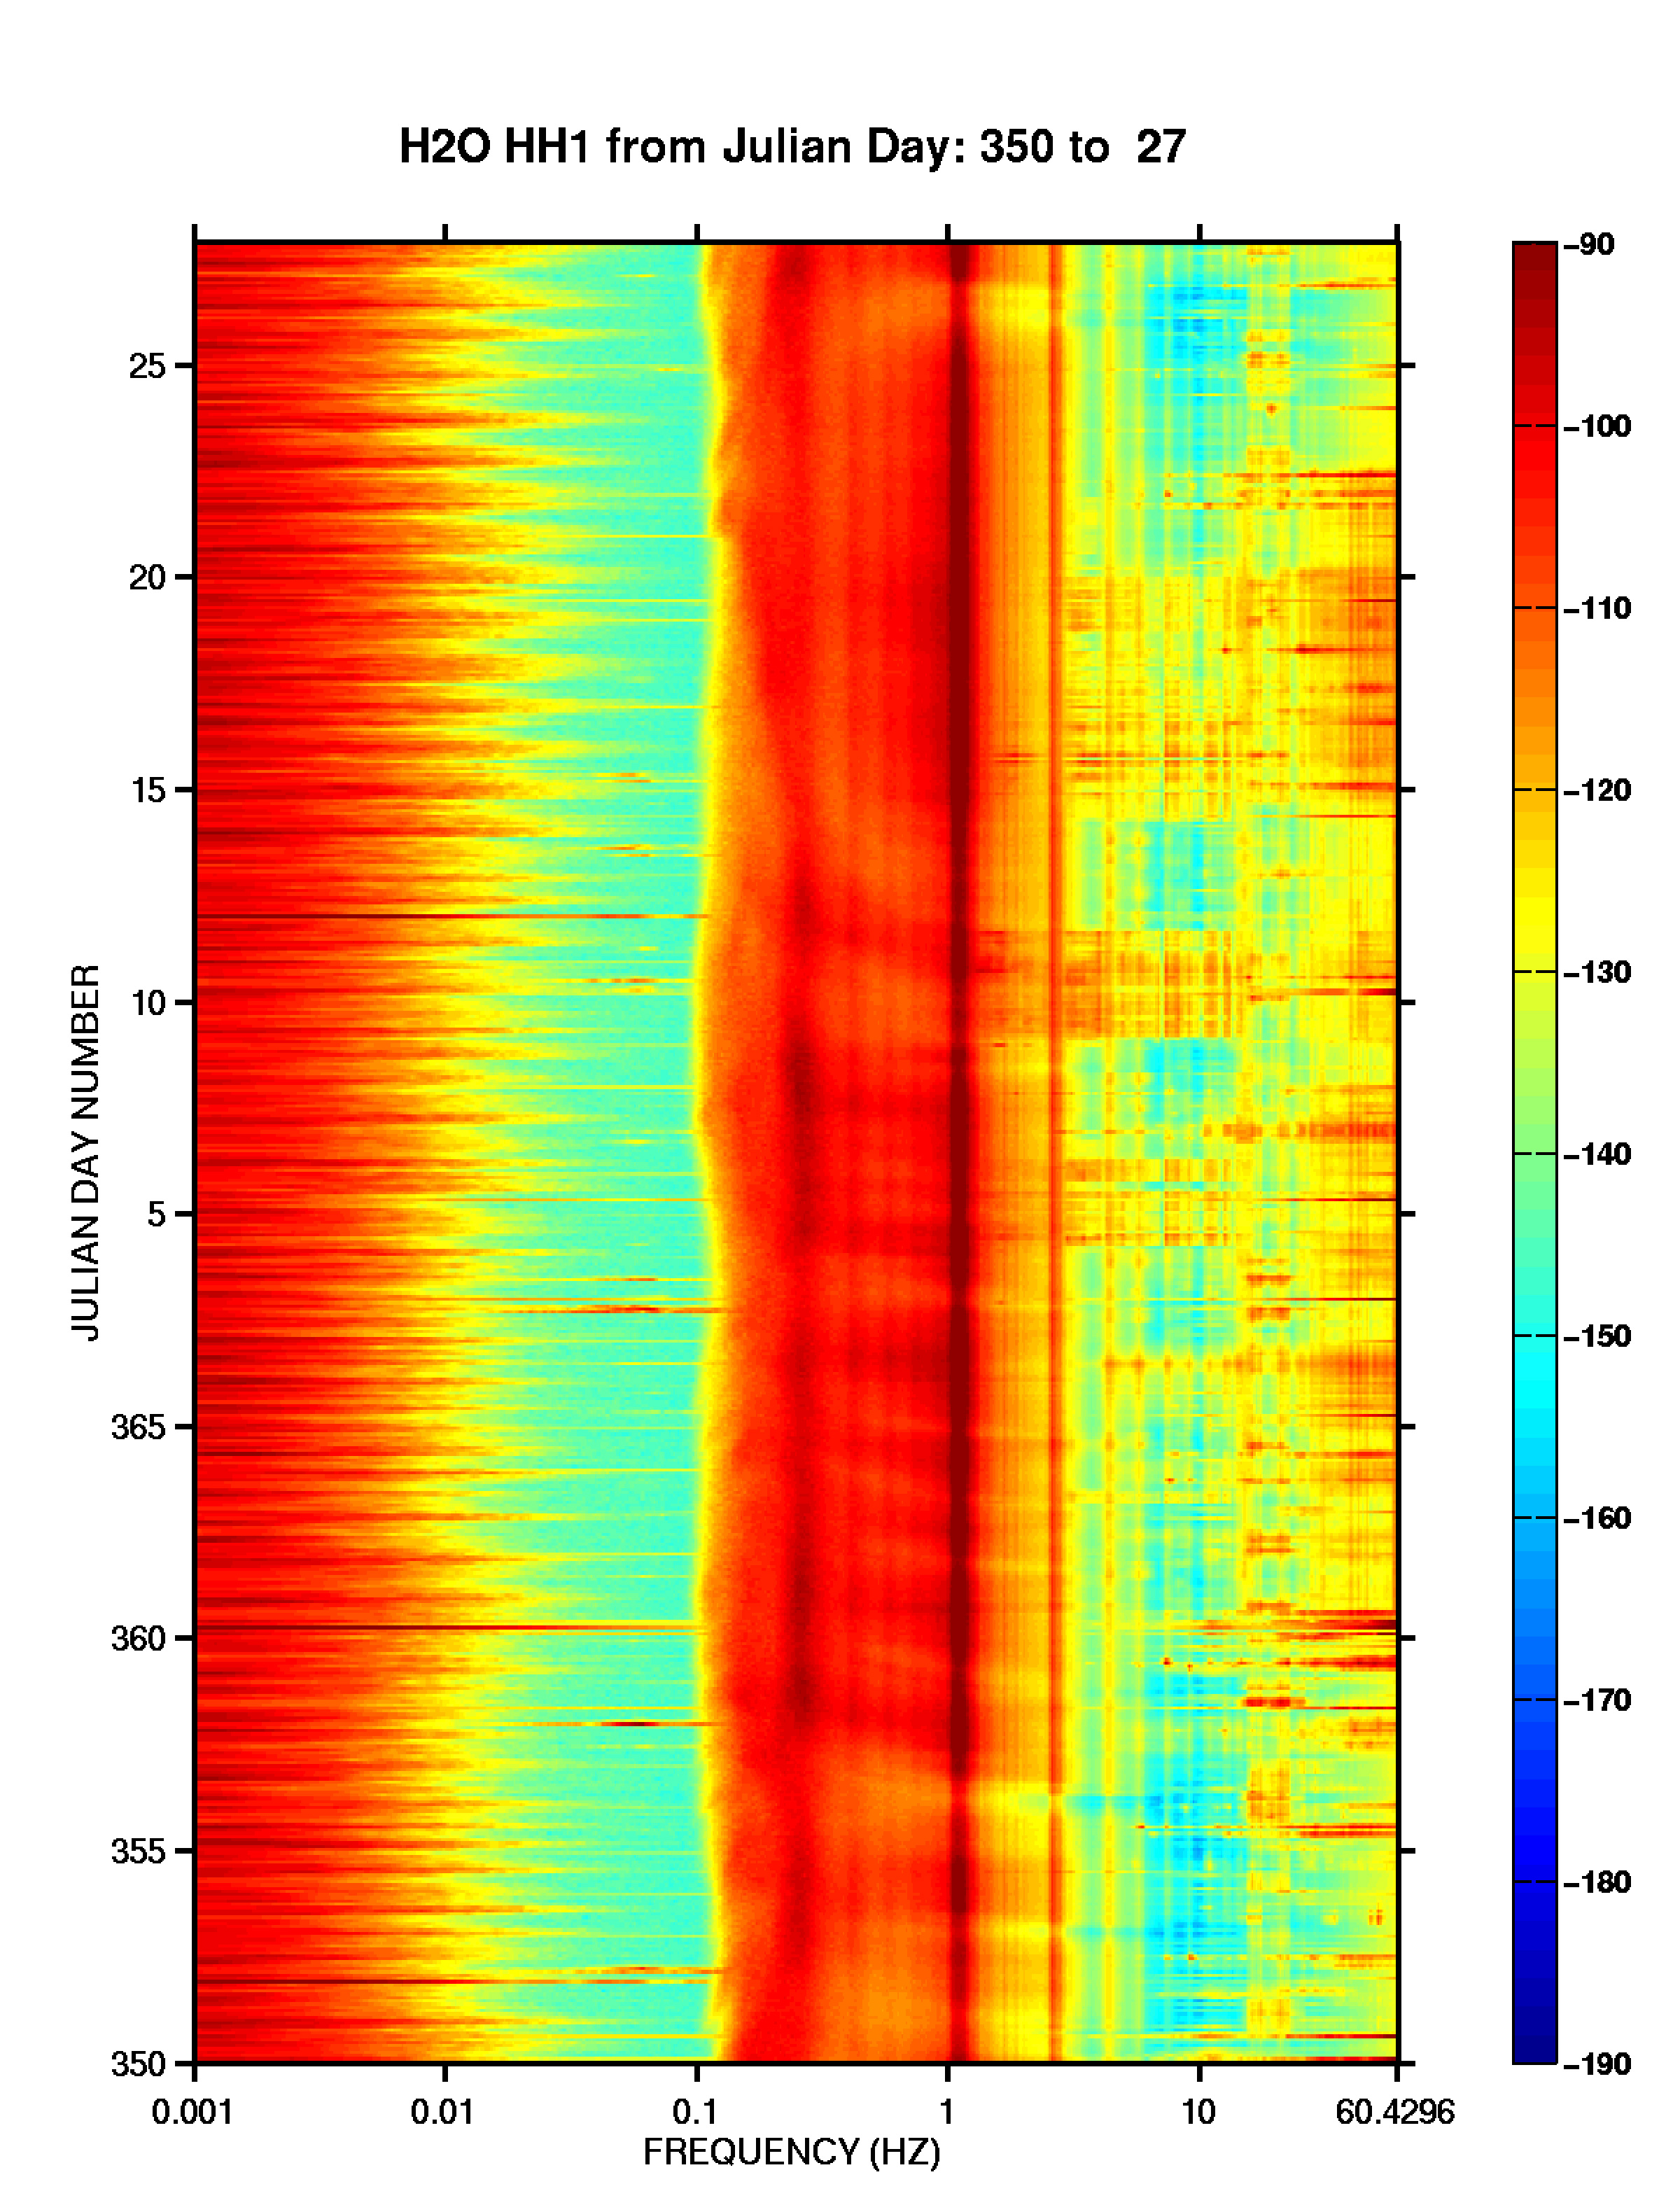
Figure 7. Spectrogram summary of ambient
noise levels on the horizontal component of the Hawaii-2 Observatory (H2O) seafloor
seismometer for the duration of Leg 200. Color, as defined in the bar on the
right, indicates the relative energy content in decibels relative to m/sec^2
squared per hertz as a function of frequency from 0.001 to 60Hz. By comparing
this horizontal component with the vertical component in Figure 6, one can see
many more constant frequency bands. The main sediment resonances near 1.1 and
2 Hz dominate even the microseism peak near 0.2 to 0.3 Hz.
![]() Retun
to the 2003 Fall AGU Poster
Retun
to the 2003 Fall AGU Poster
BROADBAND SEISMIC OBSERVATIONS AT THE HAWAII-2 OBSERVATORY DURING ODP LEG 200