The Marine Seismology and Geoacoustics Group
Plymouth Wave Lab
The Plymouth Wave Lab is a series of movies of waves on a string intended for middle school students.
Below is a series Videos in the AVI format. To view theseVideos your browser needs to be able to view AVI formatted files. These files have the extent of .avi (lower case!). Both The Windows Media Player and Quicktime programs have been used to view these Videos. Be sure your browser knows how to view an AVI file using the avi extent.
Tsunamis
The December 26, 2004 tsunami that was generated from the M9.0 Sumatra earthquake has raised public awareness worldwide of the disastrous consequences of tsunami waves. Within the context of a middle school curriculum on waves there are at least five lessons that we can learn from tsunamis.
First, all school children, and particularly school children who live near the coast, should be taught to run to high ground away from the beach if they feel an earthquake or if they observe that the water level lowers dramatically.
Second, tsunamis are an excellent example of the property of waves to transport energy without transporting mass. The water that impacted the beaches in Sri Lanka, for example, did not "come from" Sumatra; just the energy "came from" Sumatra.
Third, a ship at sea in deep water is unlikely to feel the tsunami at all. There are two reasons for this. The first reason is that the amplitude of tsunamis in the deep ocean is quite small, only a few centimeters. For example the
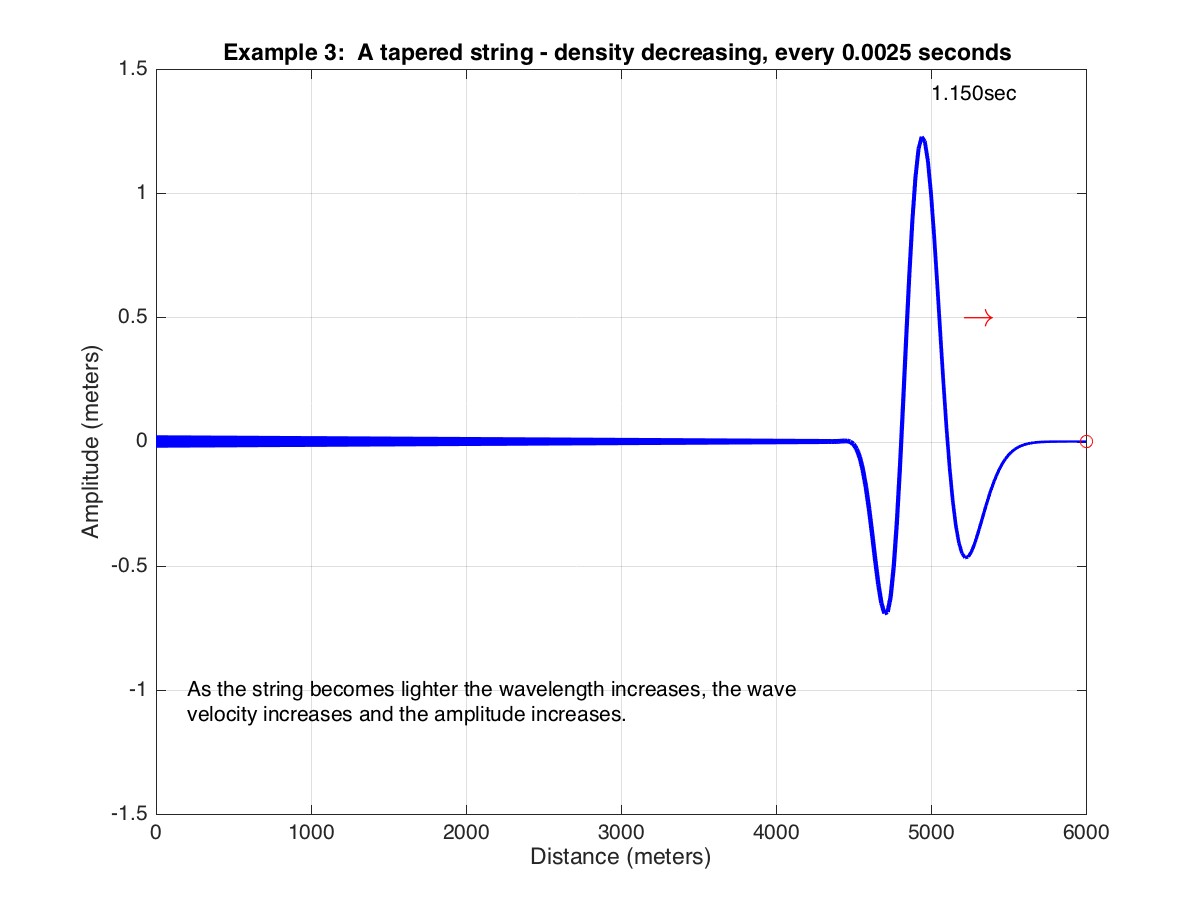
NOAA maximum amplitude map for the December 26 tsunami shows a maximum amplitude of about 50cm in the deep Indian Ocean to the west of the Andoman and Nicobar Islands. In deep water the energy of the tsunami is distributed throughout the water column which is typically 4 to 5 kilometers deep. Since the effective mass is quite large the same energy can be transported with small displacements. As the tsunami approaches shallow water the mass of available water becomes less and the amplitude becomes larger in response to conservation of energy. (For the case of waves on a string this is demonstrated in Examples 3 and 4 below for a tapered string. The wave amplitude at the heavy end of the string is less than the amplitude at the light end.) The second reason that ships at sea do not feel tsunamis is that the time it takes the sea surface to rise and fall during the passage of the tsunami is from 5 to 20minutes. Such a small change in amplitude over such a long time is unlikely to be felt by a ship.
Fourth, tsunamis provide an interesting demonstration of the relationships between period (P) and frequency(f): P=1/f, and between frequency(f), wavelength (w) and velocity (v): v = w * f . For a tsunami wave with a period of 40minutes the frequency is about 0.0004Hz (cycles per second). The wavelength of a tsunami in deep water is about 500km (see the
NOAA animation). From this we can compute the tsunami velocity to be about 200m/s or 450 miles an hour - about as fast as a commercial jet liner.
Fifth, many people might think that the NOAA tsunami buoys in the Pacific respond in some way to the sea surface response of the tsunami. The buoy, however, is just the platform for communicating the real time data to a satellite. The actual tsunami is measured by a pressure detector on the seafloor. (See the
NOAA Deep-ocean Assessment Reporting of Tsunamis (DART) web page.)
The bottom pressure sensors detect pressure fluctuations with periods longer than about 2minutes and they measure a change in sea level to better than 1mm (compared to a typical tsunami period of 6minutes and a small tsunami amplitude of about 3cm).
For Students
In all of the examples in this section a wave is excited on the string as a pulse on the left-hand side. You can imagine moving your hand up and down on the end of the string. Some machines will show the video faster than others and download times will vary - select the size of video (Large, Medium, small) that transfers and displays best on your computer.
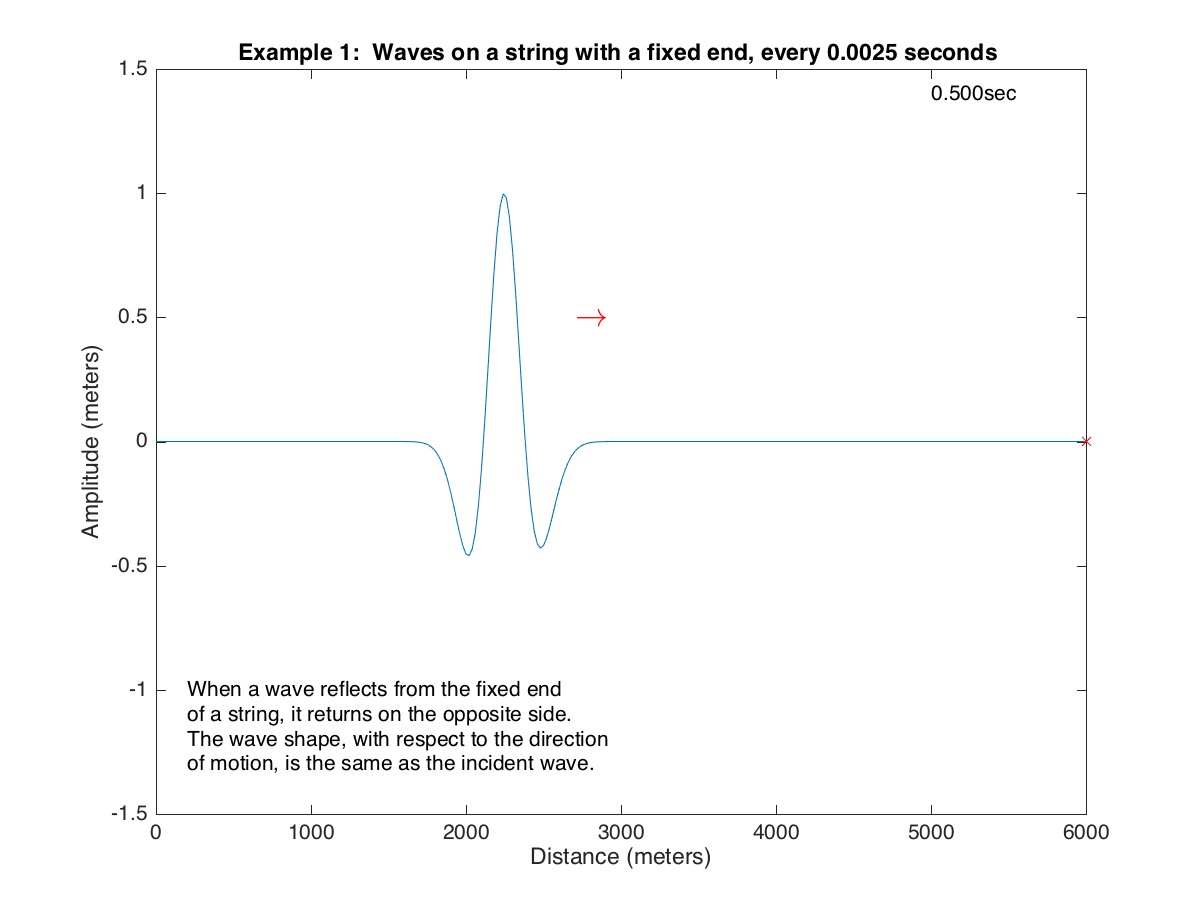
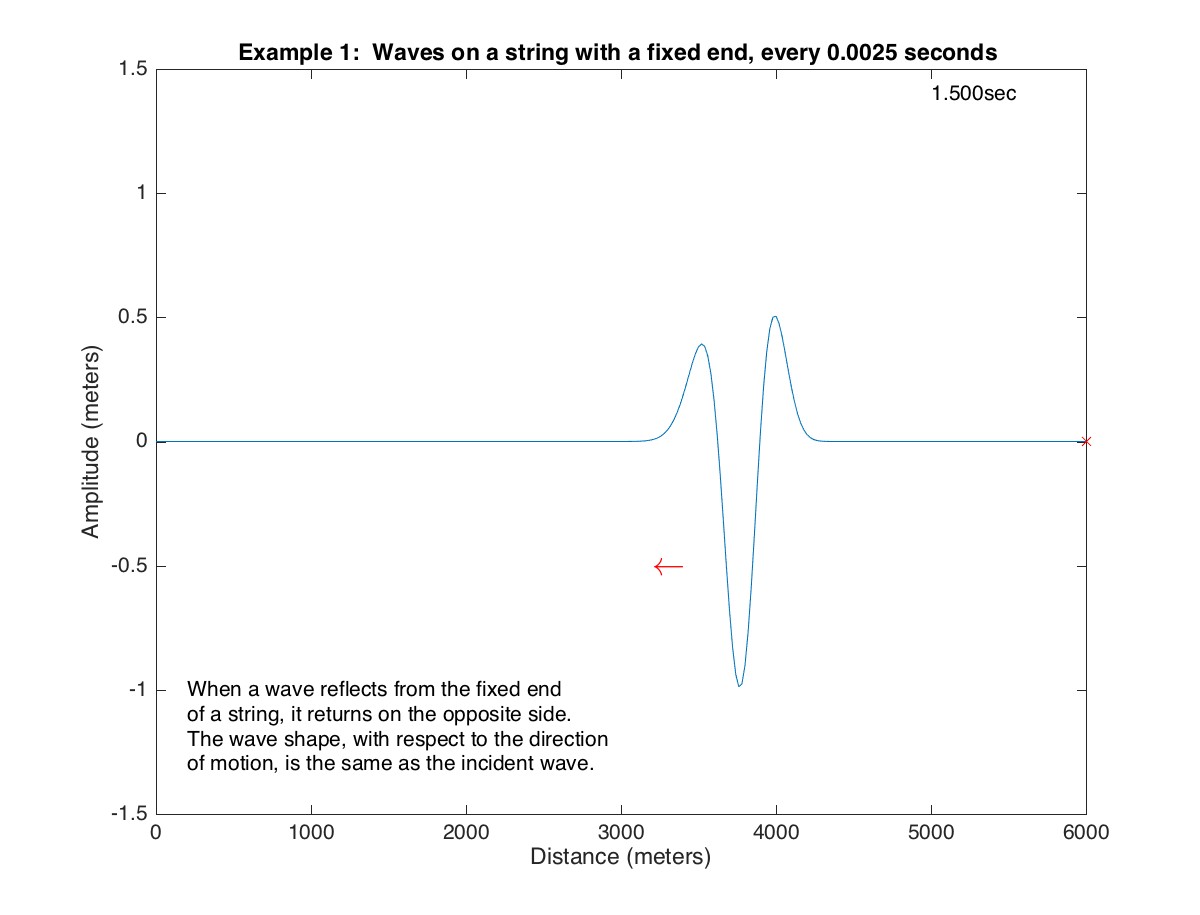
Example 1 - String with a fixed end
This video shows a wave on a string with a fixed end. At the right hand side the string is fixed as if it was tied to a wall. Can you measure the wavelength and amplitude of this pulse before and after it hits the end? What happens when the wave hits the end of the string?
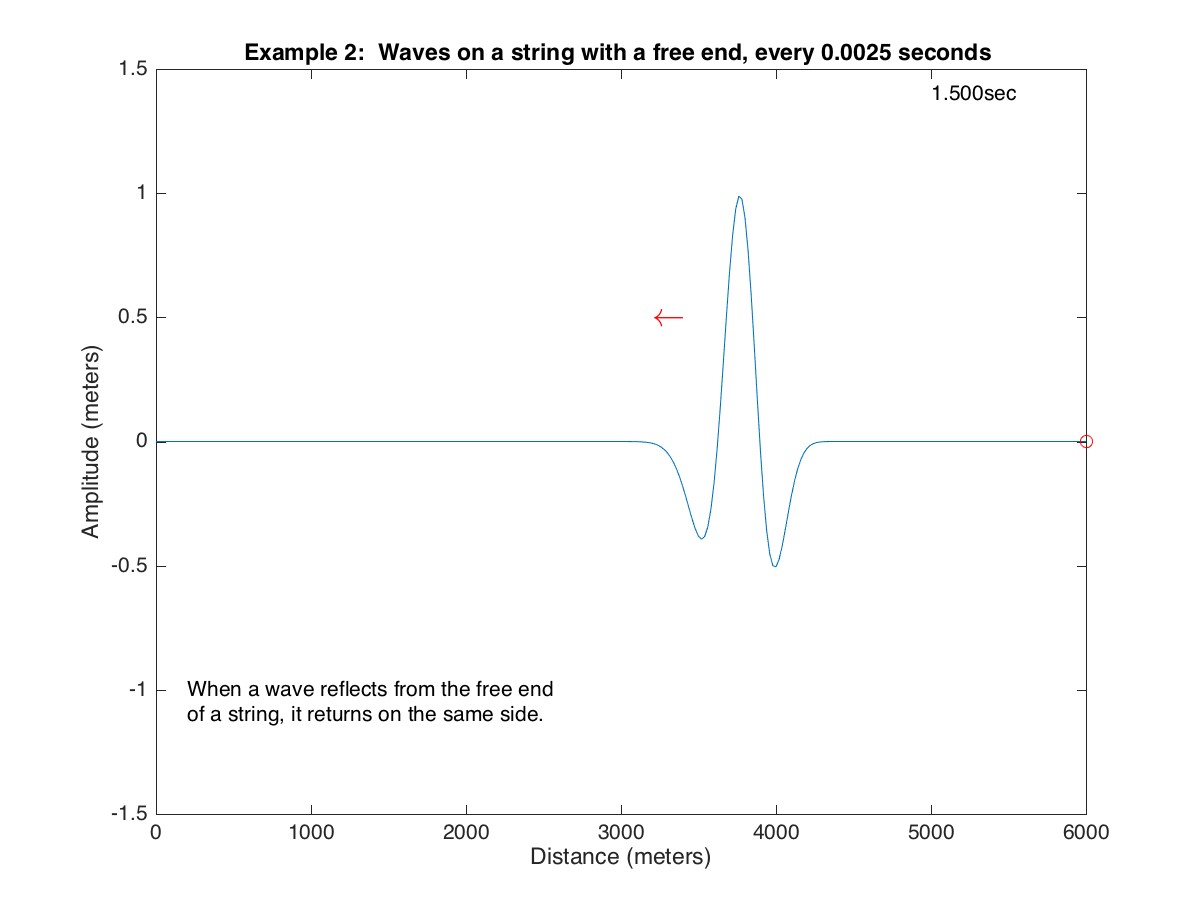
Example 2 - String with a free end
This video shows a wave on a string with a free end. At the right hand side the string is free to move in any direction. Can you measure the wavelength and amplitude of this pulse before and after it hits the end? What happens when the wave hits the end of the string? How does this differ from the fixed end case?
Example 3 - Tapered String - density (weight) decreasing
This video shows a wave on a string that gets lighter towards the right. (Young's modulus is constant.) How does the wavelength and amplitude change as the wave moves from the heavy to the light end? How is this like a whip? How is this like a tsunami?
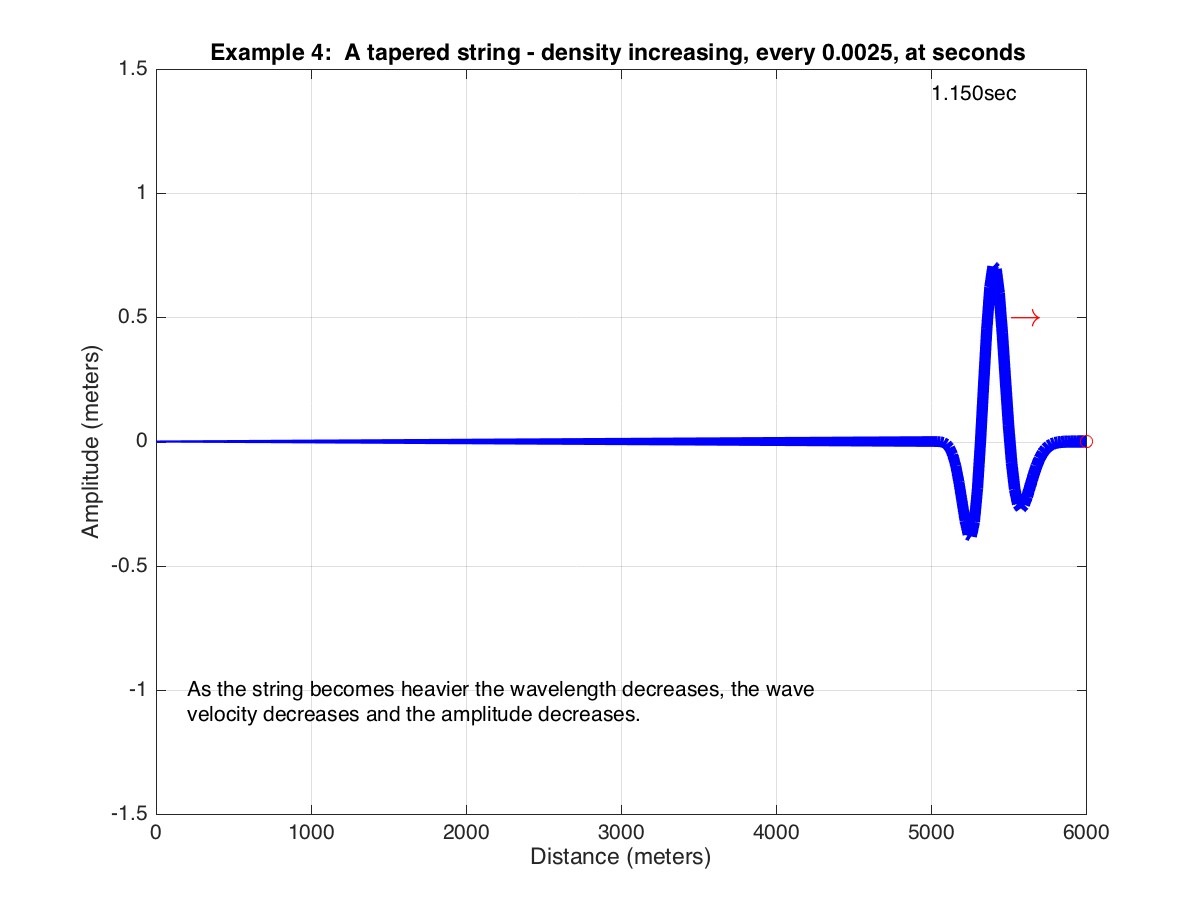
Example 4 - Tapered String - density (weight) increasing
This video shows a wave on a string that gets heavier towards the right. (Young's modulus is constant.) How does the wavelength and amplitude change as the wave moves from the heavy to the light end?
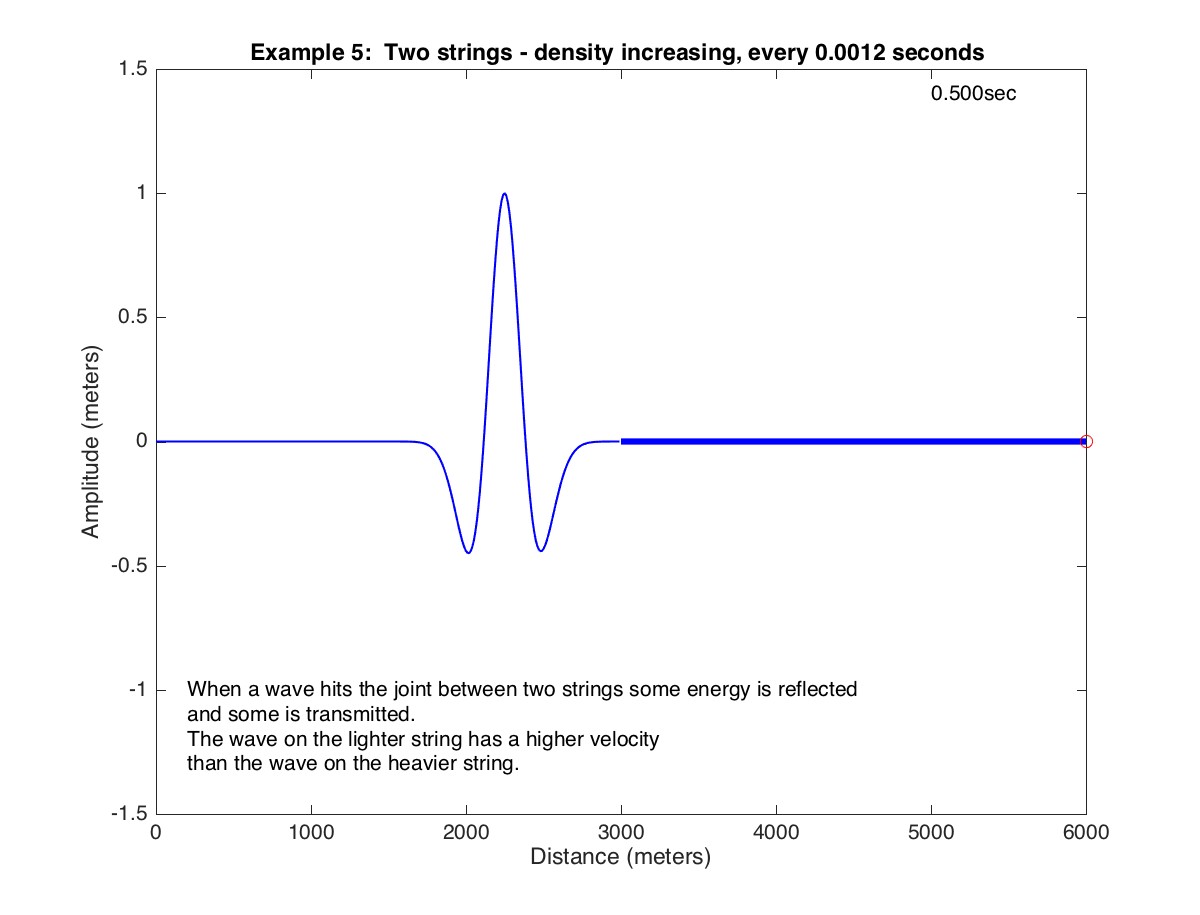
Example 5 - Two Strings - density (weight) increasing
This video shows a wave on two strings, one light and one heavy. (Young's modulus is chosen to keep the impedance constant.) The wave starts on a light string. What happens when the wave hits the intersection of the two strings? How does the wave on the light string differ from the wave on the heavy string?
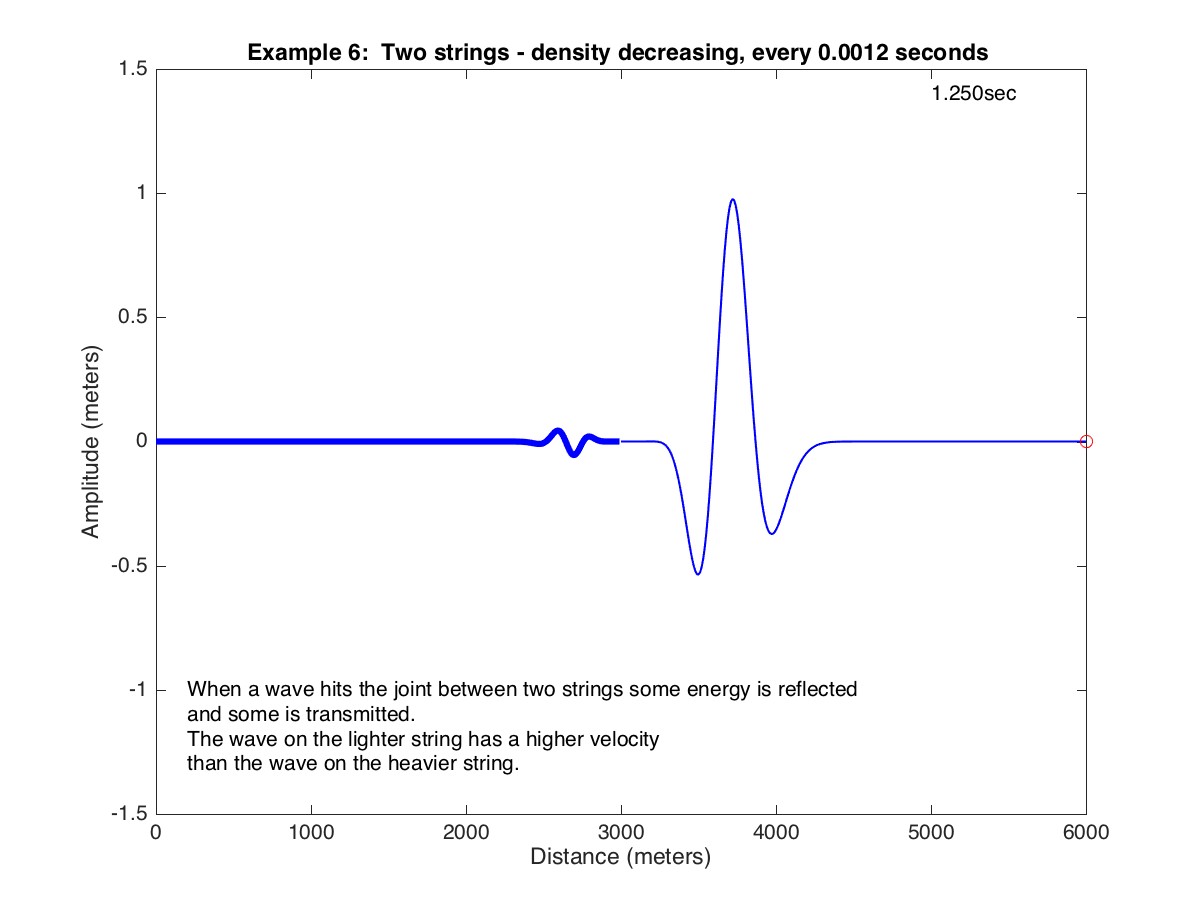
Example 6 - Two Strings - density (weight) decreasing
This movie shows a wave on two strings, one heavy and one light. (Young's modulus is chosen to keep the impedance constant.) The wave starts on a heavy string. What happens when the wave hits the intersection of the two strings? How does the wave on the heavy string differ from the wave on the light string?
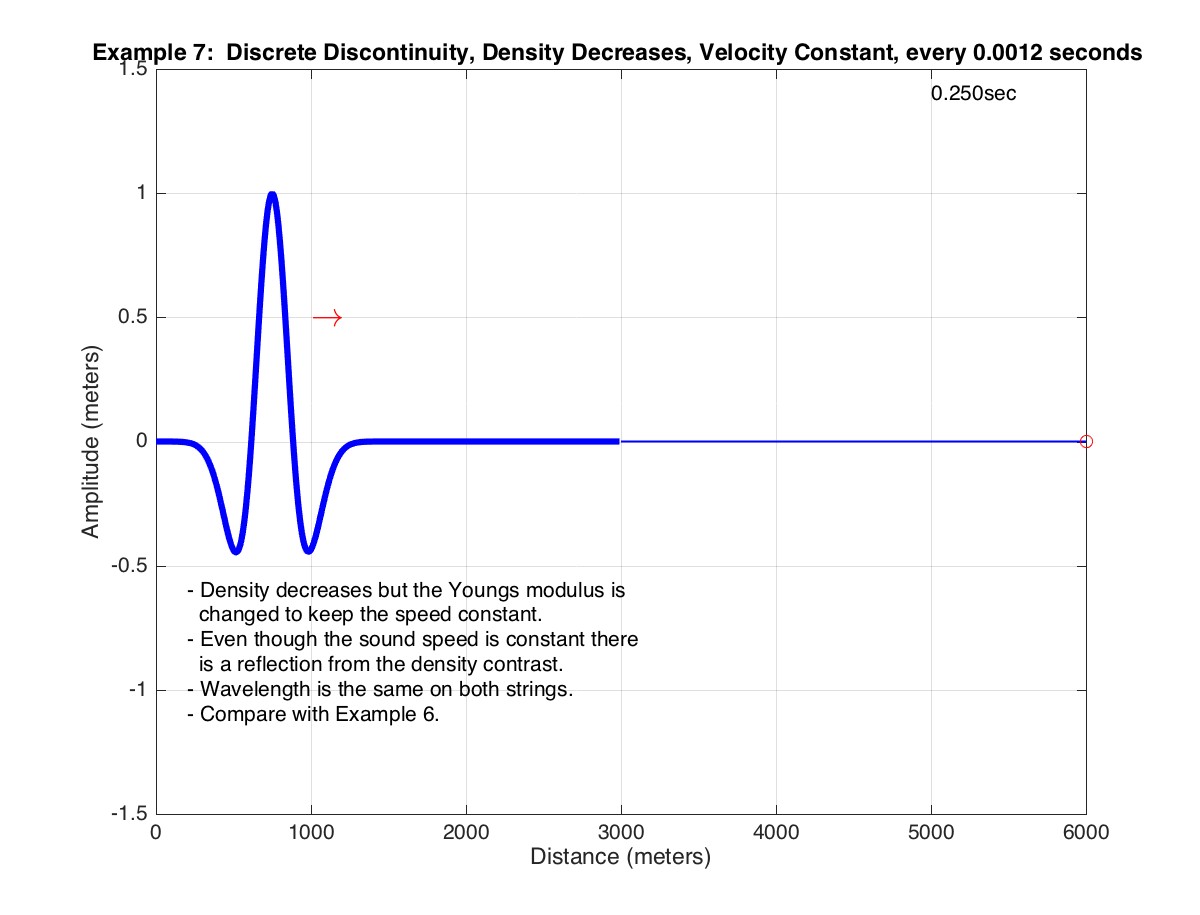
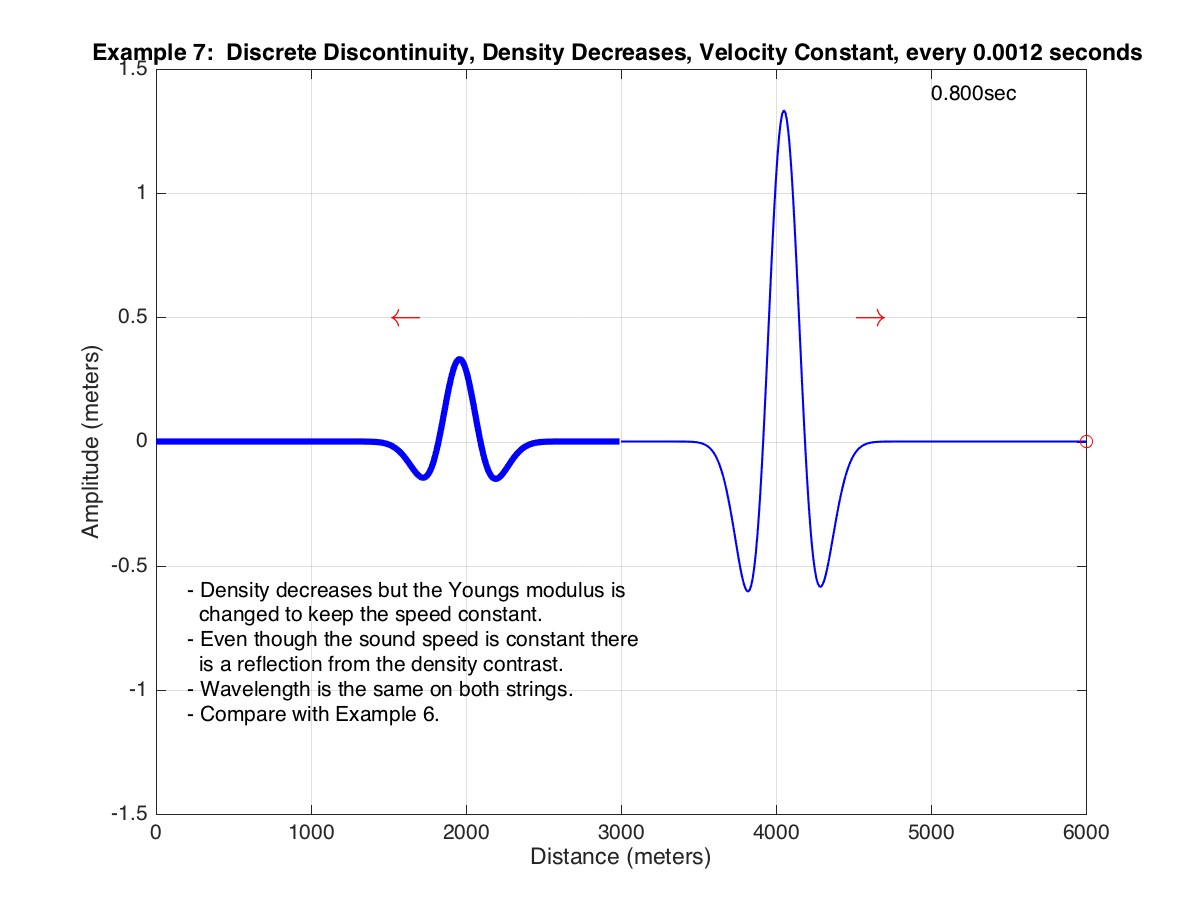
Example 7 - Two strings - density decreases, wave speed constant
This video shows a wave on two strings when the density decreases but the wave speed is constant. Even though the sound speed is constant there is a reflection from the density contrast. The wavelength is the same on both strings. Even though the transmitted energy on the right string is less than the incident energy on the left string, the amplitude is greater because the impedance (density times speed) decreases. Compare with example 6.
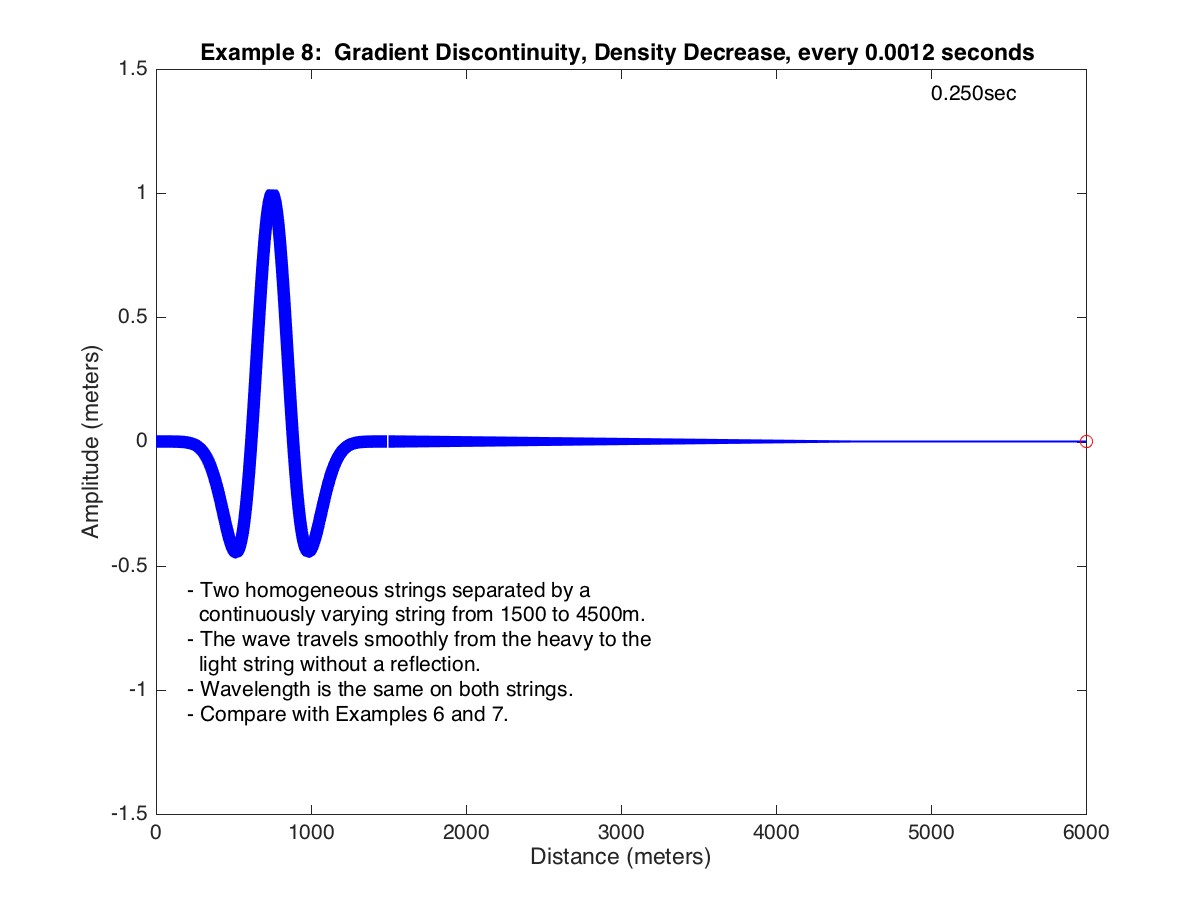
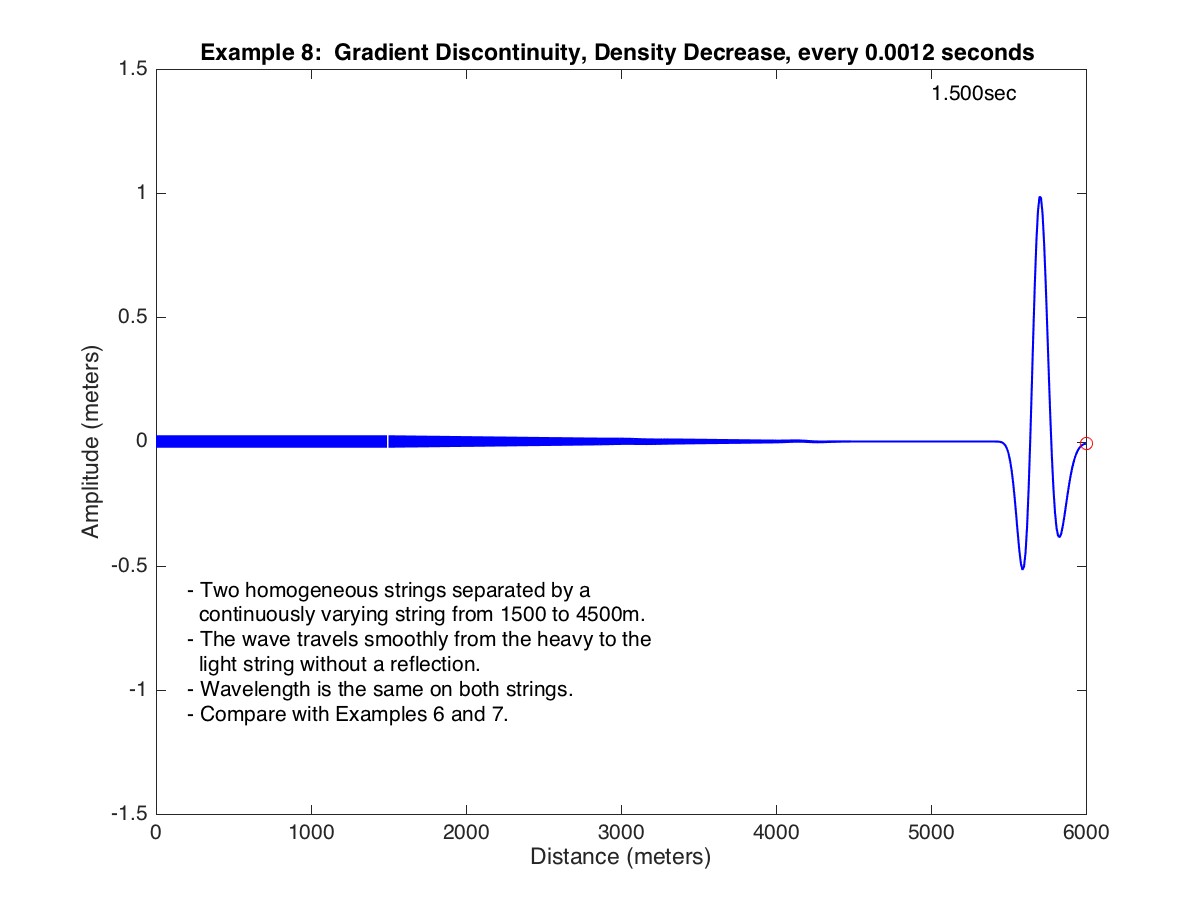
Example 8 - Two strings - gradient discontinuity, density increase
This video shows a wave on two strings separated by a third string on which the density increases continuously (a gradient). (Young's modulus is chosen to keep the impedance constant.) The gradient is gradual enough that no energy is reflected. Compare with examples 4 and 5.
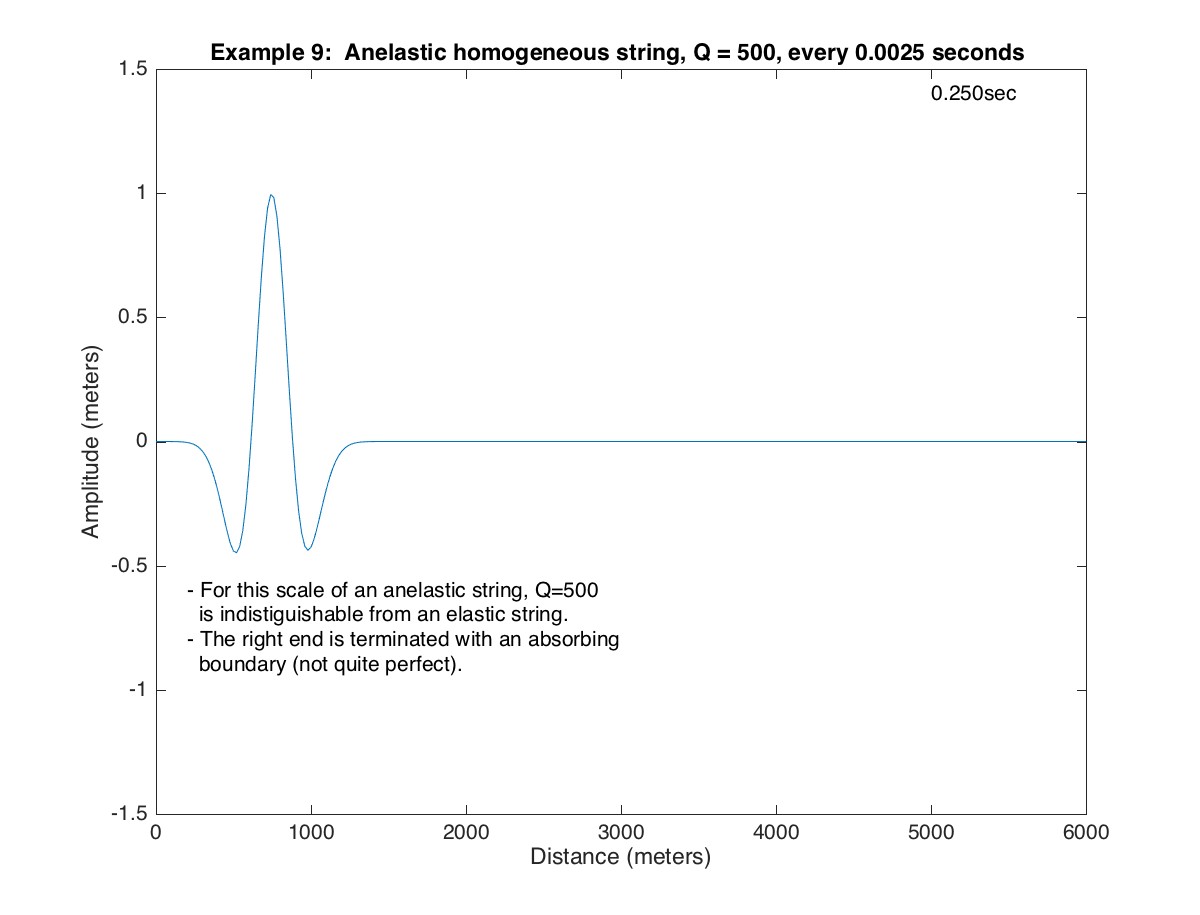
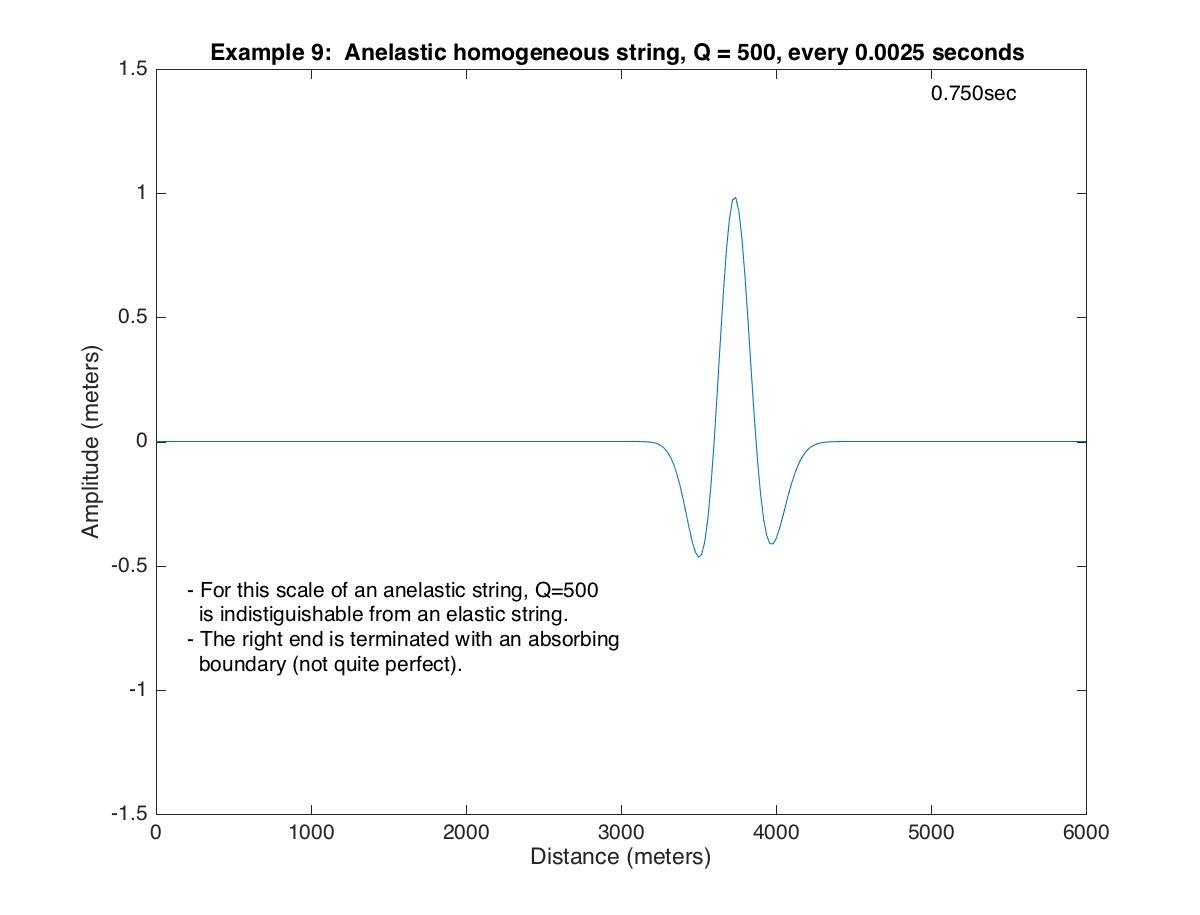
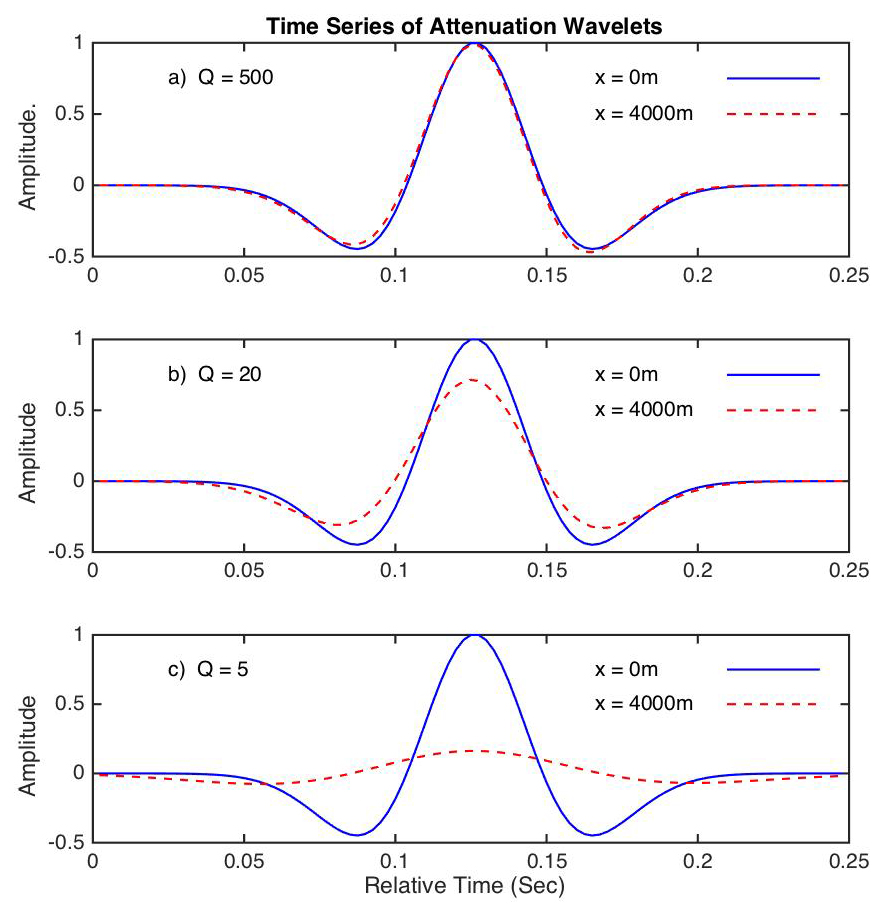
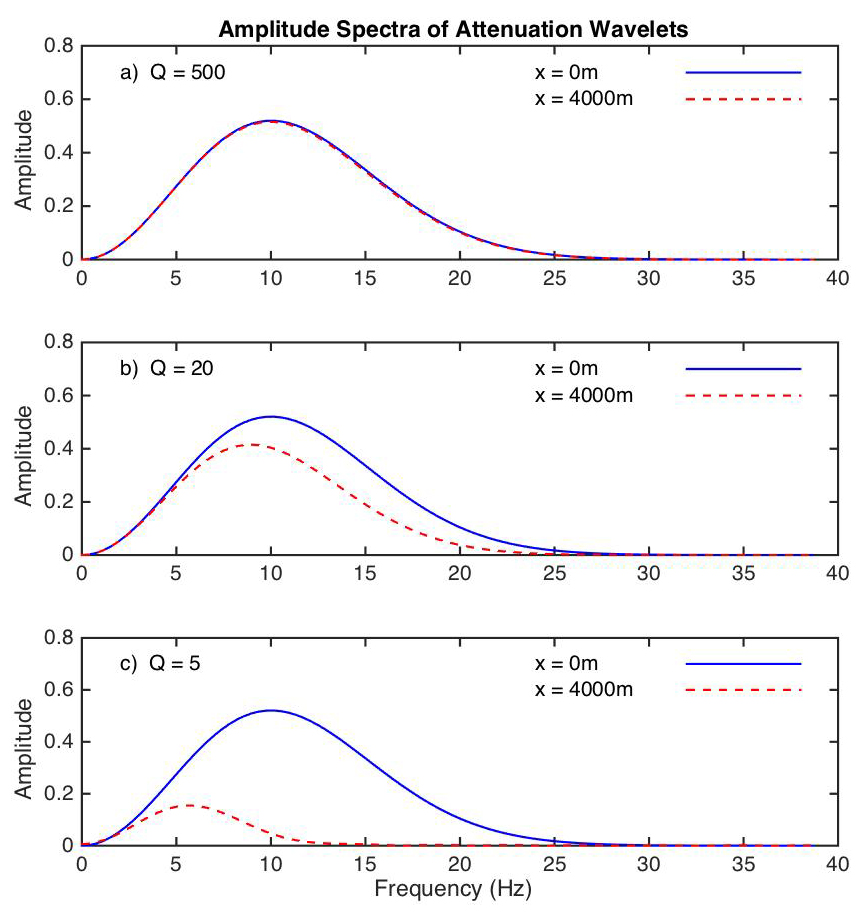
Example 9 - One string with low attenuation (Q = 500)
This video shows a wave on an anelastic string with low attenuation (Q=500). At this scale the propagation is indistinguishable from a perfectly elastic string.
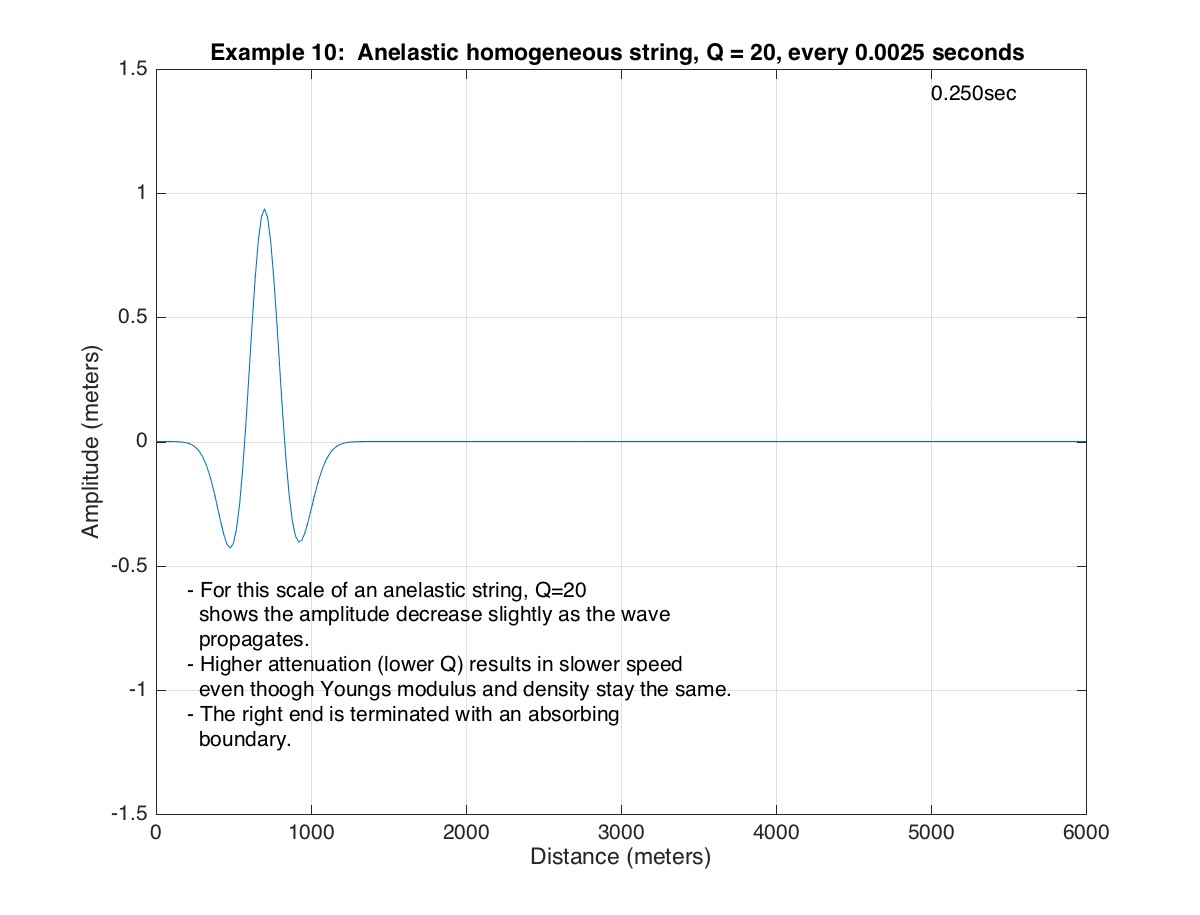
Example 10 - One string with moderate attenuation (Q=20)
This video shows a wave on a homogeneous anelastic string with moderate attenuation (Q=20). The wave amplitude decreases as the wave propagates but the wave also slows down due to dispersion (the density and Young's modulus do not change from Example 9).
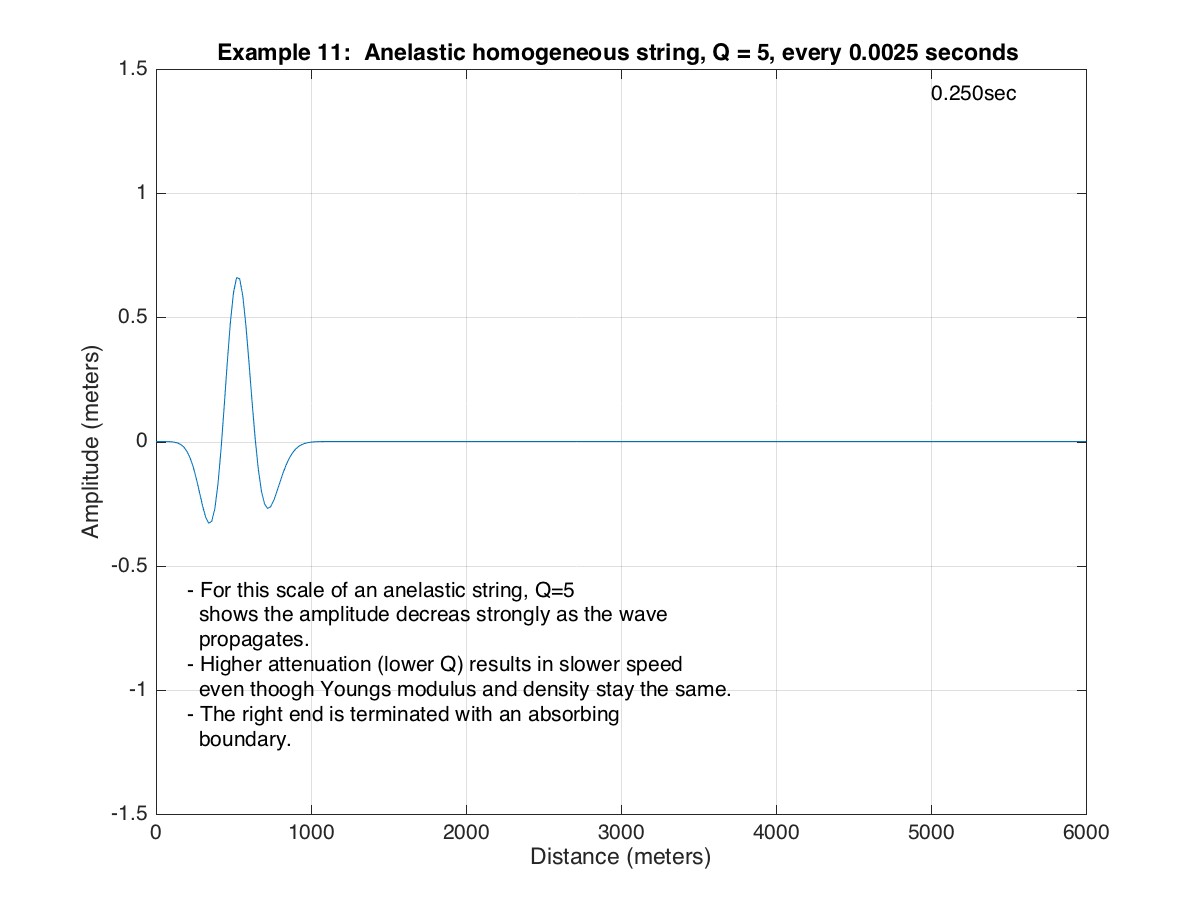
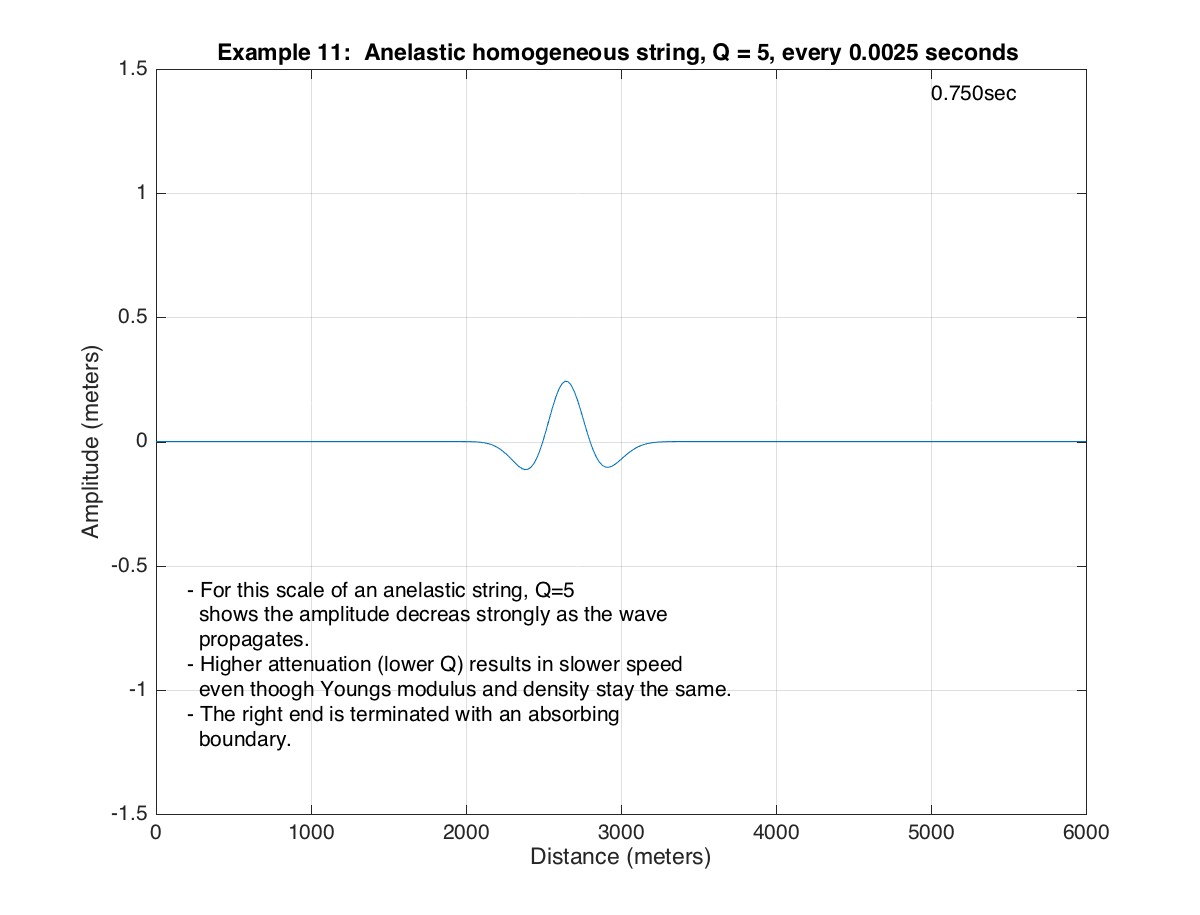
Example 11 - One string with high attenuation (Q=5)
This video shows a wave on a homogeneous anelastic string with moderate attenuation (Q=5). The wave amplitude decreases dramatically as the wave propagates but the wave also slows down due to dispersion (the density and Young's modulus do not change from Examples 9 and 10).
Discussion of Attenuation (Examples 9-11)
Intrinsic attenuation of elastic waves is always associated with dispersion, frequency dependent speed. As a pulse propagates, the higher frequencies are reduced more rapidly. The higher the attenuation (lower Q) the slower the pulse propagates, even though Young's modulus and density stay the same. Figure A compares the wave shapes at 0 and 4000m for the three attenuations in Examples 9, 10 and 11 (Q of 500, 20 and 5). Figure B shows the corresponding spectra. The higher frequencies decay more rapidly than the lower frequencies resulting in a change of wave shape, not just a change in amplitude.

Figure A.

Figure B.
This web site was developed under support from the National Science Foundation under Grant #OCE-0424633 and #OCE-1260094.
This page was updated by Tom Bolmer on
April 9, 2016
.
Send comments and questions to:
Tom Bolmer
Woods Hole Oceanographic Institution
Woods Hole, Mass.


