Go to the recent NBP0202 Cruise Track
Go to the original Marguerite Bay Digital bathymetry for the Southern Ocean GLOBEC study area
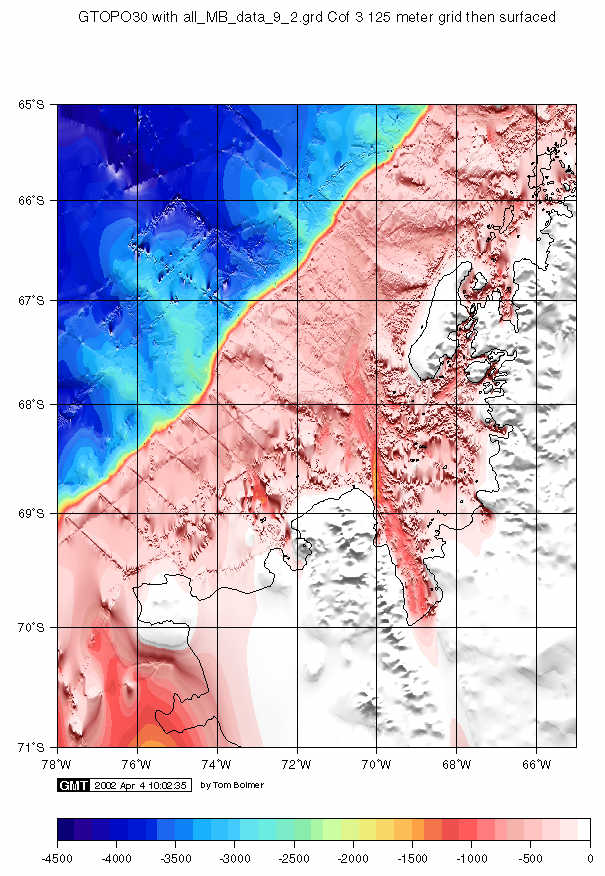
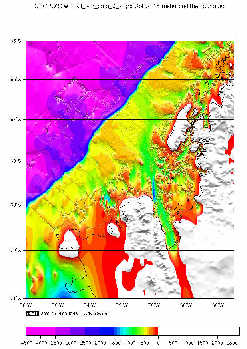
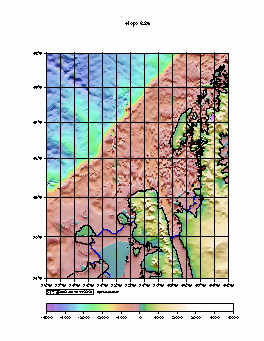
PLOT as of April 1, 2002
Below is a plot of the data as of April 4, 2002. This is created from the gridded data to date. The gridded data were turned into an ASCII XYZ file in which the NaNs were removed. The data were then merged with data from the GTOPO30 land data base. These data were then run through the GMT blockmean and surface programs to create a new grid entirely derived from the assembled bathymetry data and the land data. The below plot shows the result of this work. The original grid had 3 cells of padded data and was gridded at 125 meters. If no data occured in a grid cell, a NaN was used in that cell.
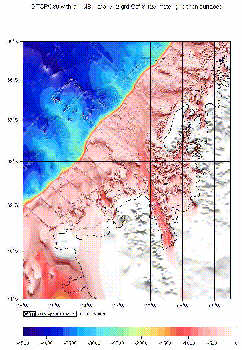
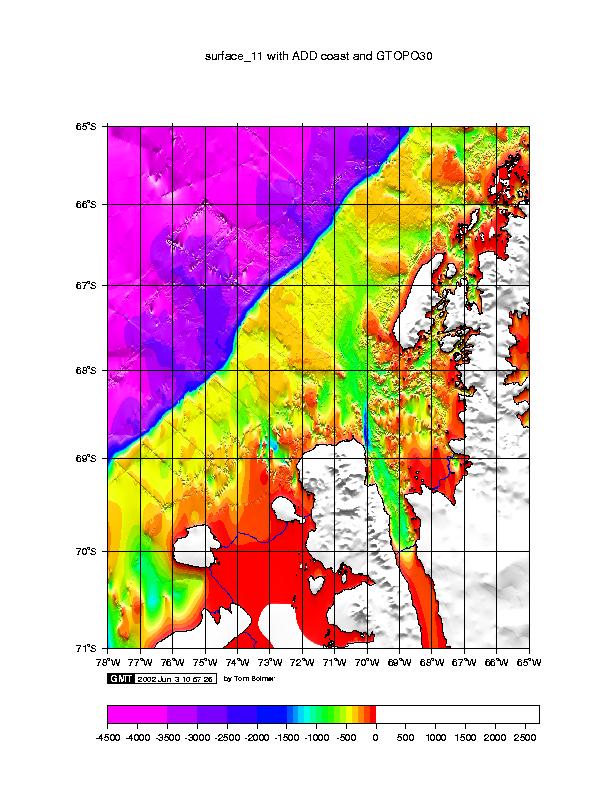
All of the Data Assembled by April 3, 2002, were merged with the GTOPO30 dataset and then run through the GMT Surface program. The figure on the left uses the rainbow coloring scheme used in the figures above. The figure on the right uses the Haxby coloring scheme for a more "tradional" coloring of the data. Please note that the data set in the two figures shows the status of the data to date. It is not a final product. The data still need to be checked for bad values and the sound velocity profiles need to adjusted.
PLOT as of May 1, 2002

Below is a reworking of the data using the Antarctic Digital Database CD-ROM published in 1993 by the ICSU Scientific Committee on Antarctic Research (SCAR) and compiled jointly by the British Antarctic Survey, the Scott Polar Research Institute and the World Conservation Monitoring Centre; Cambridge, UK. The data from the Multibeam, NGDC MGD77, and underwiegh JGOFS data that werea gridded using the mbsystem mbgird program were made into ASCII data with no NaN's. This data was then merged with the SCAR coastline data and the GTOPO30 land 30second data. The new data were then surfaced using the GMT surface program. This new plots has the coastline comfoming much better to the assembled data than has prefiously been available.
Recent NBP0202 Cruise track

Status as of May 31, 2002
Below is a plot of the data as of May 31, 2002. This includes the data from NBP0202 and selected sections of NBP0201. This is created from the gridded data assembled to date. The gridded data were turned into an ASCII XYZ file in which the NaNs were removed. The data were then merged with data from the GTOPO30 land data base. These data were then run through the GMT blockmean and surface programs to create a new grid entirely derived from the assembled bathymetry data and the land data. The below plots show the result of this merging. The original grid had 3 cells of padded data and was gridded at 125 meters. This version includes the coastline from the SCAR 1:1 million antarctic coastline. The blue line is the edge of the ice shelf as of the SCAR data base creation.
There are some problems with the coastline data in the upper Right corner of the plot. Also, in the South in the ice shelf off of Alexander Island there are some contouring artifacts that must still be addressed.
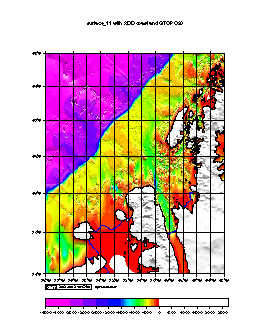
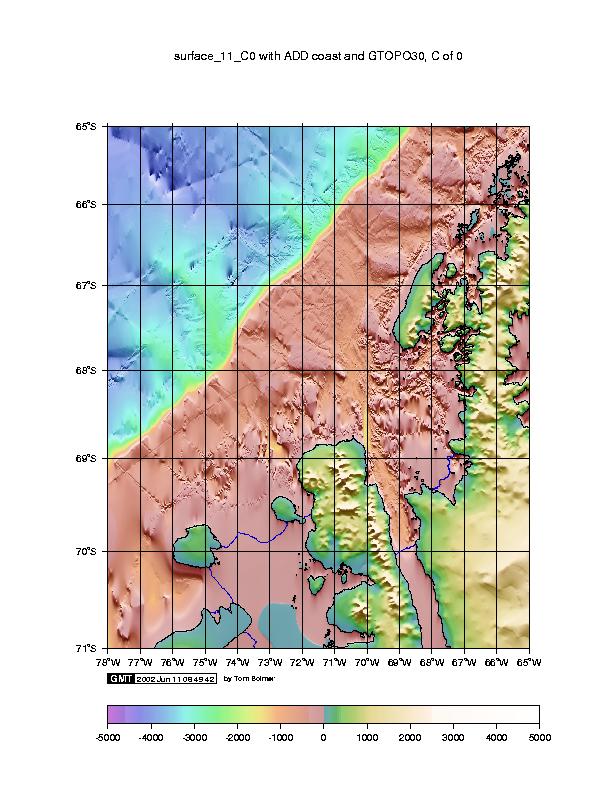
Data Assembled by May 31, 2002.
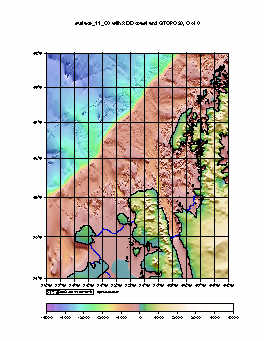
The figure on the left uses the rainbow coloring scheme used in the figures above. The figure on the right uses the Haxby coloring scheme for a more "tradional" coloring of the data. Please note that the data set in the two figures shows the status of the assembled data to date (May 31, 2002). It is NOT a final product. The data still need to be checked for bad values and the sound velocity profiles need to adjusted. On NBP0202 an attempt was made to adjust the velocity of sound in the NBP0103 data set, but I believe work on this leg is still needed. I am still trying to fine tune a coloring scheme to best show the seafloor features.
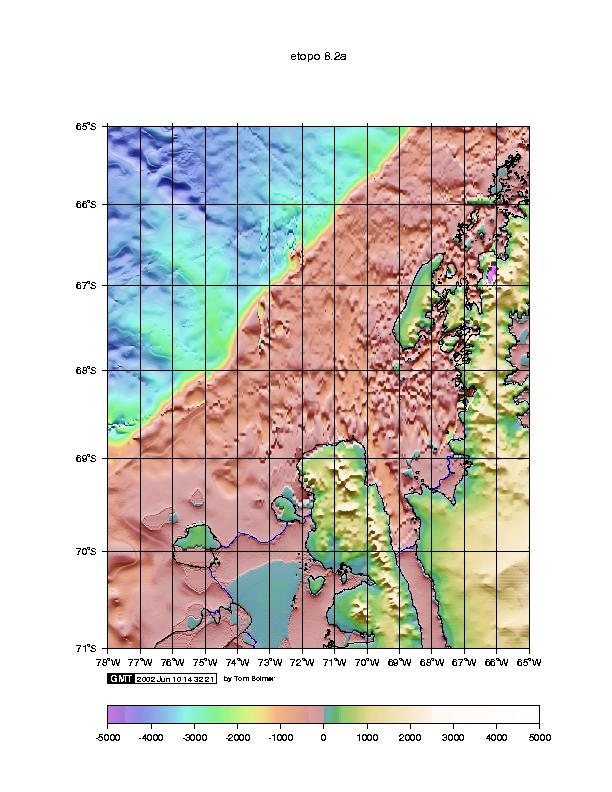
The figure on the left is from the etopo 8.2 data that was merged with the Didigitized charts as referenced in The Sothern Ocean Bathymetry page. This figure was colored with the sample color file as the plot to the upper right. None of the new cruise data or NGDC data searchs have been added here. This clearly shows the problems with the Gravity derived bathymetry and the improvements we have made in this area in understanding the bathymetry.
Acknowledgements:
We want to thank all those who helped in collecting and processing
multibeam data on the Palmer and Ross during this last year. Funding for
the post-cruise processing of the Palmer data and merging the Palmer, Ross
and other data is covered by NSF Office of Polar Programs grant OPP810092.04.
Return to the TOP
Go to the original Marguerite Bay Digital bathymetry for the Southern Ocean GLOBEC study area
This page was created by Tom Bolmer.
send comments and questions to:
 Tom Bolmer.
Last Modified 04/04/02