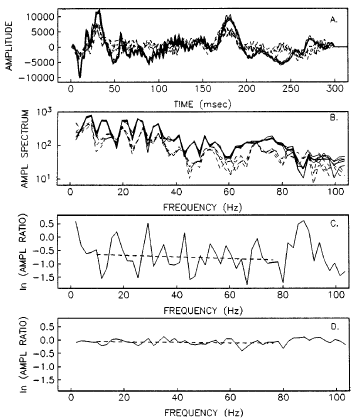

Figure 10: This is an example of the spectral ratio method used to infer Q
from the data in Figure 8. (a) Solid lines are five traces obtained at 149mbsf;
dashed lines are four traces obtained at 434m. The travel time to the first
arrival has been removed and the trace truncated at a length of 0.3sec with
a cosine taper. Note the decrease in amplitude of the primary pulse and the
bubble pulse at about 180ms. (b) Spectra of the nine traces in (a) using the
same line styles. Spectra at each depth are stacked before computing the amplitude
ratios. (c) The dashed line is the linear regression fit to the amplitude ratios
between 10 and 75Hz. Q is determined from the slope of the amplitude ratios
as a function of frequency [Hauge, 1981]. The regression gives a Q of 46. (d)
The stack of the spectral ratios obtained from 13 receiver pairs has a linear
regression fit corresponding to a Q of 26. [Swift and Stephen, 1992] Pain 1a
 Retun
to the 2003 Fall AGU Poster
THIRD PARTY BOREHOLE SEISMIC EXPERIMENTS DURING THE OCEAN DRILLING PROGRAM
Created on December 10, 2003 by Tom Bolmer