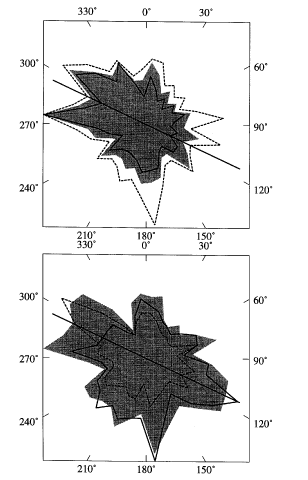

Figure 7: Polar plots of coda energy for receiver depths of 230m (a) and 430m (b). The solid line with azimuth of 295degrees indicates the spreading direction at the site based on magnetic lineations. In (a) the solid gray area, solid line and dashed line indicate different lengths of the coda window used (1.0, 0.5 and 1.5 sec respectively). In (b) the solid gray area, solid line and dashed line indicate the effects of the start time of the coda window after the S arrival (1.1, 0.8, and 1.4 sec respectively). [Dougherty et al., 1995]
 Retun
to the 2003 Fall AGU Poster
THIRD PARTY BOREHOLE SEISMIC EXPERIMENTS DURING THE OCEAN DRILLING PROGRAM
Created on December 10, 2003 by Tom Bolmer